Streamlining Student Learning Reports with Business Intelligence

Student learning reports are essential for evaluating school performance, providing a comprehensive overview of each student's academic journey. These reports typically include detailed data on homework completion, attendance, language proficiency, and exam results. However, compiling and analysing this wealth of information can be time-consuming and complex, taking valuable resources away from educators.
This is where Business Intelligence (BI) tools, like those within the Deesha portal, become invaluable. Deesha leverages the power of Power BI to streamline the reporting process, making it more efficient, dynamic, and customisable. Real-time updates and interactive reports provide immediate access to key insights. Seamless data interconnection allows effortless navigation from high-level school summaries to detailed individual student performance with just a few clicks.
Furthermore, Deesha's BI reports incorporate embedded AI tools, such as AI Narratives and Key Influencer analysis. These powerful features analyse diverse data points to uncover hidden trends and actionable insights, empowering schools to make informed decisions regarding curriculum planning, resource allocation, and targeted student support, ultimately enhancing the learning experience and improving student outcomes.
Want to reclaim valuable time and empower data-driven decisions in your school? Contact us today to learn more about Deesha.
Deesha's Academic Achievement Reports: Drill-Down to Actionable Insights
Deesha's academic achievement reports provide a complete picture of student performance, from high-level group overviews to granular student-level details. Our pre-built templates offer insights into exam results for each curriculum and subject across academic years. Leveraging the power of MS Power BI dashboards, educators can easily benchmark school performance against regional and national averages.
School Group Performance: Understanding Group-Wide Trends
The school group report provides a high-level overview of performance across all schools within a group or trust. Key metrics include:
Student headcount
Exam participation rates
Average Points Score (APS) by curriculum and subject
Comparison against national benchmarks
Pass rates
Critically, Deesha's drill-through functionality empowers users to delve into the data, navigating from the group level to individual schools and then to specific student subject scores (group > school > student, curriculum > subject). This granular analysis makes it easy to pinpoint areas of strength and weakness, enabling targeted interventions and improvements.

Deesha's reports offer powerful visual comparisons of school performance. Clustered column charts enable side-by-side comparisons of average curriculum performance across multiple academic years against national benchmarks. Average subject performance can also be compared across schools over time, with associated pass rates clearly displayed.
Interactive drill-through functionality enhances data exploration, allowing users to seamlessly transition from group-level data to detailed school-specific reports by simply right-clicking on a school within a filtered academic year, curriculum, or subject combination.
Deesha provides a holistic view of academic achievement by facilitating comprehensive comparisons across all curricula and subjects within the school group. This enables users to analyse performance across the entire group, regardless of initial filters, providing a complete picture of academic achievement.
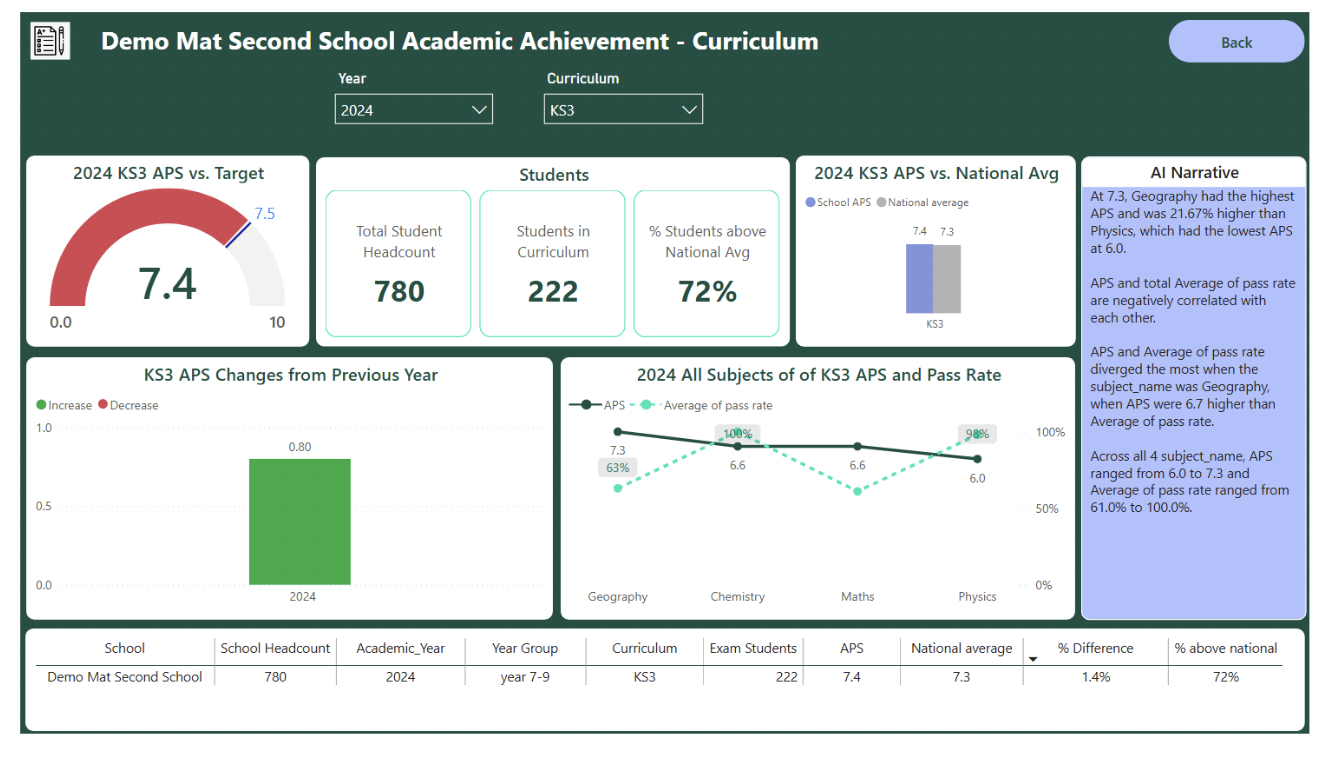
Drilled-Through Curriculum Report: School-Specific Curriculum Performance
Power BI enables the creation of two types of curriculum reports: drilled-through and non-drilled-through.
This drilled-through curriculum report offers a school-specific view, filtered to show performance for a chosen curriculum during a particular academic year. Key performance indicators include student headcount, exam participation, and the percentage of students performing above the national average.
A gauge visualisation tracks the curriculum's Average Points Score (APS) against its target for the year, using RAG (Red, Amber, Green) status indicators. A clustered bar chart compares the school's APS to the national average for the selected curriculum.
A line chart displays both the APS and pass rates for all subjects within the curriculum. Year-over-year changes in curriculum APS are visualised using coloured bars.
All data is also presented in a table, accompanied by an embedded AI Narrative that automatically generates a summary of the page’s findings. The report is fully dynamic, with all visuals and the AI narrative updating automatically when filters are adjusted.
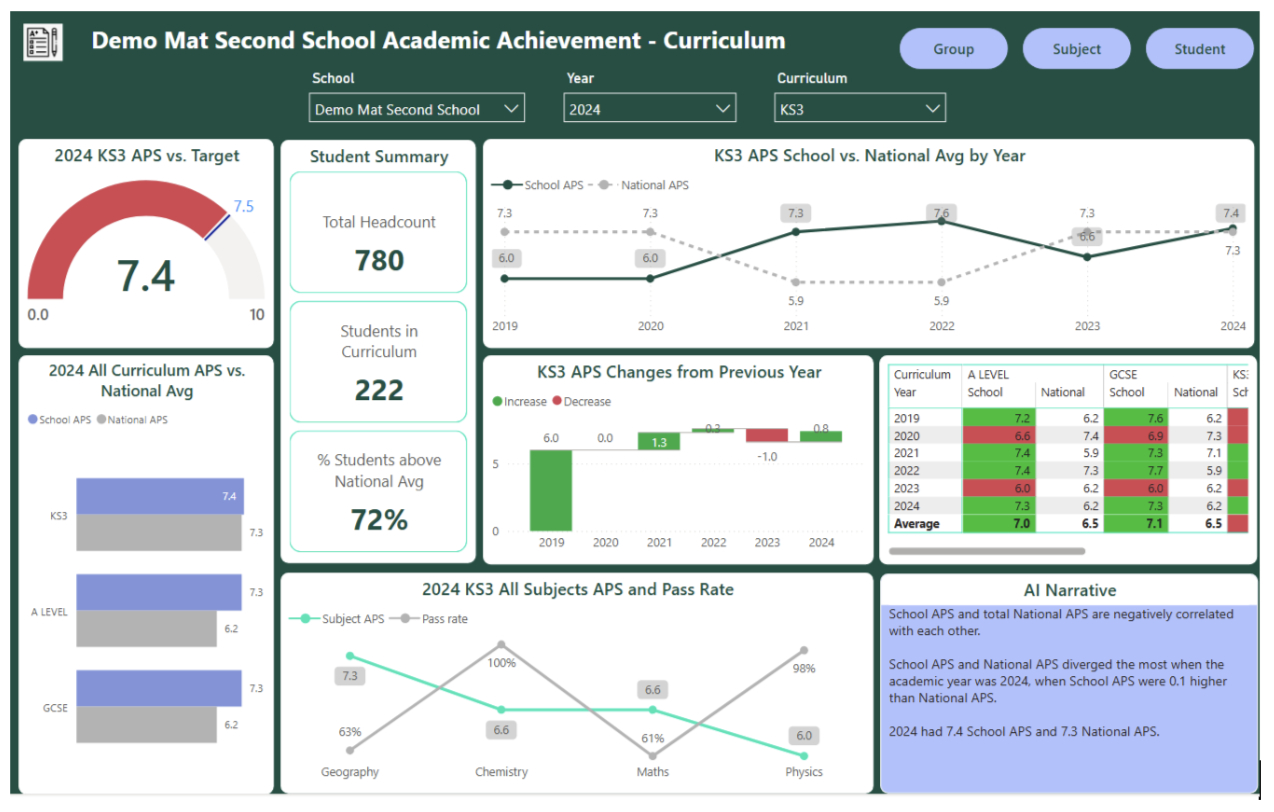
Non-Drilled-Through Curriculum Report: Broad School-Level Comparisons
This intuitive, school-level dashboard offers a broad view of curriculum performance, making it easy to analyse data and track progress. Educators can compare a single curriculum or all curricula, filtered by academic year or across multiple years. A curriculum and target achievement gauge provides an at-a-glance overview.
Key features include:
Trend analysis: Track curriculum APS against the national average over time with a dedicated line chart.
Subject-level detail: Explore subject APS and pass rates for all subjects within a selected curriculum using another line chart.
Benchmarking: Compare curriculum APS against the national benchmark for all curricula via a bar chart.
Year-over-year insights: Visualise curriculum APS changes with a clear waterfall chart.
Comprehensive overview: A RAG-colored heatmap table shows performance for all curricula and academic years against the national benchmark.
Plus, a dynamically updating AI Narrative automatically summarises key findings, providing actionable insights at your fingertips.
Drilled-Through Subject Report: Focused Subject-Level Insights
Similar to the curriculum report, Power BI enables the creation of two types of subject-level reports: drilled-through and non-drilled-through.
This report provides a granular, school-level view of subject performance. Filtered by curriculum, all subjects, or a specific subject within a chosen academic year, it offers key insights into student achievement.
Metrics include:
Student headcount
Curriculum enrollment
Exam participation
Pass rate
Percentage of students exceeding the national average
Subject evaluation results
A gauge visualisation tracks the subject's Average Points Score (APS) against its target for the year, using RAG (Red, Amber, Green) indicators. Bar charts compare the school's APS and pass rate with the school group average. Year-over-year changes in subject APS are displayed with colored bars. All data is also presented in a detailed table.

Non-Drilled-Through Subject Report: Data-Driven Insights for Subject Improvement
This school-level dashboard empowers data-driven decisions by offering a broad view of subject performance. Educators can compare a single subject or all subjects across multiple academic years, filtered by curriculum and year.
Key features include:
Subject target achievement gauge for at-a-glance progress tracking.
Student summary metrics for a quick overview of performance.
Line chart tracking subject APS and pass rate over time.
Waterfall chart visualising year-over-year APS changes.
Evaluation table showing subject evaluation results based on students exceeding the national average.
Comparison table providing a comprehensive view of all subject data, including targets, pass rates, and percentage above the national average.
An AI-powered narrative dynamically summarises the data, offering deeper insights to inform strategic decisions.
Ready to unlock deeper insights into your subject performance? Contact us today to learn more about Deesha.
Homework and Lessons Report: Comprehensive Overview and Drill-Down for Enhanced Student Engagement
Deesha's Power BI reports offer a comprehensive overview of student performance related to homework completion and lesson attendance. These reports allow for side-by-side comparisons of schools and regions, with detailed data segmented by curriculum and subject, and organized by academic year and month. Key metrics, such as homework completion rates and lesson attendance status, are clearly displayed, providing a clear picture of student engagement and academic progress.
Interactive features, including dynamic AI-generated narratives, automatically summarize key trends and insights, enhancing the user experience. The powerful drill-through capability allows users to seamlessly explore specific data points in greater detail, accessing granular information for individual schools, curricula, or subjects. This combination of high-level overviews and detailed insights makes the report a powerful tool for monitoring and improving student engagement and performance across the entire school network.

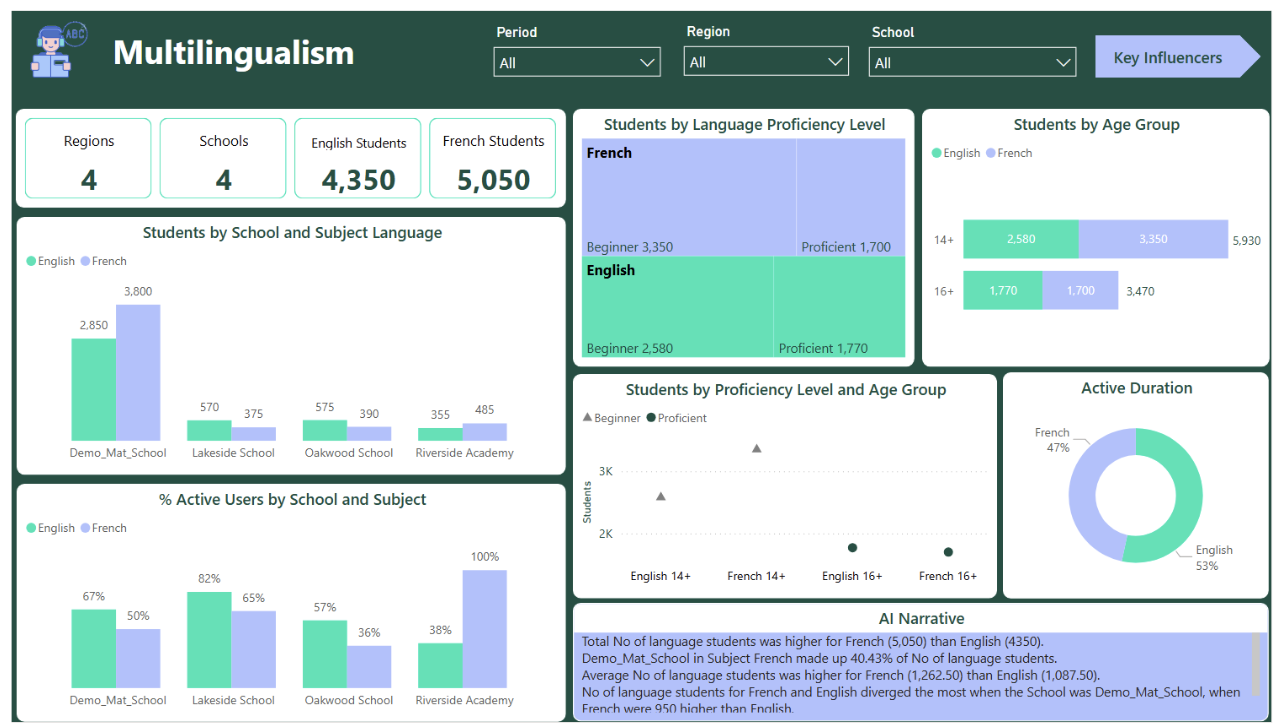
Multilingualism Report: Insights and Improvement in Language Learning
Many student learning reports include language studies, such as multilingualism, a key focus in many educational settings. Using Deesha's BI tools, schools can generate both high-level and detailed reports on language learning, providing valuable insights into student progress.
These reports detail the number of students studying each language, broken down by proficiency level, age group, and active status.
Power BI enables schools to track key performance indicators related to language study, such as student distribution across different language types, language proficiency progress, and engagement levels. These metrics help schools better understand their students' language learning journeys, identify trends, and pinpoint areas for improvement.
Connecting the Dots: Key Influencer Analysis for Improved Student Outcomes
Student exam results are influenced by a variety of factors, including homework completion, lesson attendance, and overall study engagement. Deesha's reports link these factors together, identifying the key drivers of student academic performance and quantifying their impact.
The Deesha template incorporates AI-driven key influencer analysis to provide actionable insights into which factors most significantly affect exam results and the extent of their influence. This analysis allows educators to understand the underlying reasons behind student performance, enabling them to focus on the most impactful elements to improve academic outcomes. Teachers and administrators can improve student accomplishment more successfully by focussing on these important aspects.
Streamlining Student Learning with Deesha's BI-Powered Reports
Student learning reports are fundamental to a school's success, providing a holistic view of each student's progress. Deesha offers a comprehensive portal that tracks student performance across a wide range of metrics, from homework completion and lesson attendance to language proficiency and academic achievements.
Analysing this volume of data can be a significant challenge. Deesha's BI-powered reports, leveraging the strength of Power BI, streamline this process, enabling the creation of dynamic and personalised reports. Educators can easily access and analyse student data, saving valuable time and resources.
Deesha goes beyond simple reporting, uncovering valuable insights hidden within your data. Deesha assists schools in making data-driven decisions that improve instruction, boost student assistance, and maximise the educational experience for every student by seeing trends, patterns, and areas for development.
Transform your student learning data into actionable insights. Contact us today to see Deesha in action.